Open Access statistics
Both nationally and locally at DTU, there is a focus on Open Access publishing. For example, the proportion of Open Access publications is included in the departments' annual reporting. In this context, a national indicator exists, and DTU Library continuously monitors Open Access with statistics that we make available to everyone at DTU.
DTU Open Access statistics
DTU Library continuously monitors Open Access figures for DTU. We have integrated the Open Access statistics for DTU publications into DTU Findit, in what we call DTU Research Output Statistics. These statistics provide input for the annual statistics. Open Access reports are generated twice a month throughout the year.
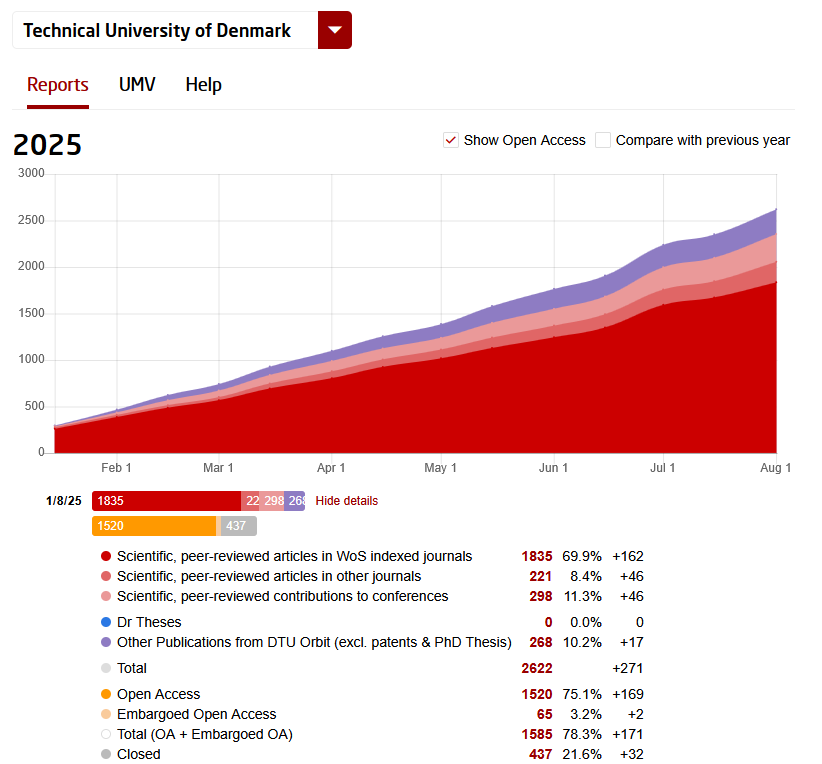
See the Open Access figures - tick the box “show Open Access”
The figures in DTU Open Access statistics originates from DTU Orbit.
The scope of DTU’s Open Access figures is published scientific, peer reviewed journal articles and conference contributions to journals and proceedings with ISSN that are downloadable from DTU Orbit or published in an Open Access Journal. I.e. the same publication types that form the basis of the Danish Open Access Indicator (see below).
The statistics consist of three categories:
- Open Access: publications that can be freely downloaded from DTU Orbit
- Embargoed Open Access: publications under embargo
- Closed: publications that are not affiliated with an OA-accessible or embargo-covered publisher version or post-print.
By default, the figures covers the entire university, but you can find the Open Access statistics for your department or section by selecting the drop-down menu next to “Technical University of Denmark” or by clicking the link Overview of sub organizations.
If you want to know which publications fall into a particular category, click on the red number. You then get an overview of all the publications. Please note that the DTU Findit overview is "live" and updated regularly - unlike the figures in the statistics reports, which are locked.
Open Access figures for the annual reports and the departments strategic plan
The figures that you see in the reports tab is the current Open Access figures. Here, you can see the Open Access status of the publications that have been added to DTU Orbit during the year in question.
You will find the figures that are reported to the UMV/Annual report in the UMV tab. Like the Open Access Indicator, the Open Access figures are based on publications published two years back. For example, the final 2024 Open Access figures are released in March 2025 and are based on publications published in 2023 – this to allow for an entire year’s embargo period.
The UMV/Annual report figures (both publication and Open Access figures) are released in January every year.
However, the Open Access figures are updated in March every year and the new figures are added to the UMV-statistics/Annual report. This is to ensure that DTU’s Open Access figures are as close to the national Open Access Indicator figures as possible. The indicator figures are released in March/April every year.
The Open Access Indicator
Denmark's National Strategi for Open Access, states that by 2025, 100% of Danish peer-reviewed scientific articles issued from Danish Research institutions must be published Open Access.
The implementation of the Danish Open Access Strategy is monitored by means of the Open Access Indicator.
Open Access Indicator
The figures in the Open Access Indicator are based on publication data from the Danish universities – at DTU, this means DTU Orbit.
The scope of the Indicator is peer-reviewed, scientific publications published in conference proceedings or journals with ISSN.
The National Strategy allows for an embargo period of up to 12 months. The figures in the Open Access Indicator are based on publications published two years back. This is done in order to include publications with a 12-month embargo published late in the year.
Read more about the calculations (in Danish)